
WiFi Signal Strength dBm Chart: Is −70 dBm Good?
−70 dBm is "usable but not comfortable" — web browsing is fine, 4K streaming and video calls start to wobble. dBm values are negative, and closer to zero is stronger: −50 is far better than −70. Here is the full banding and how to measure it.
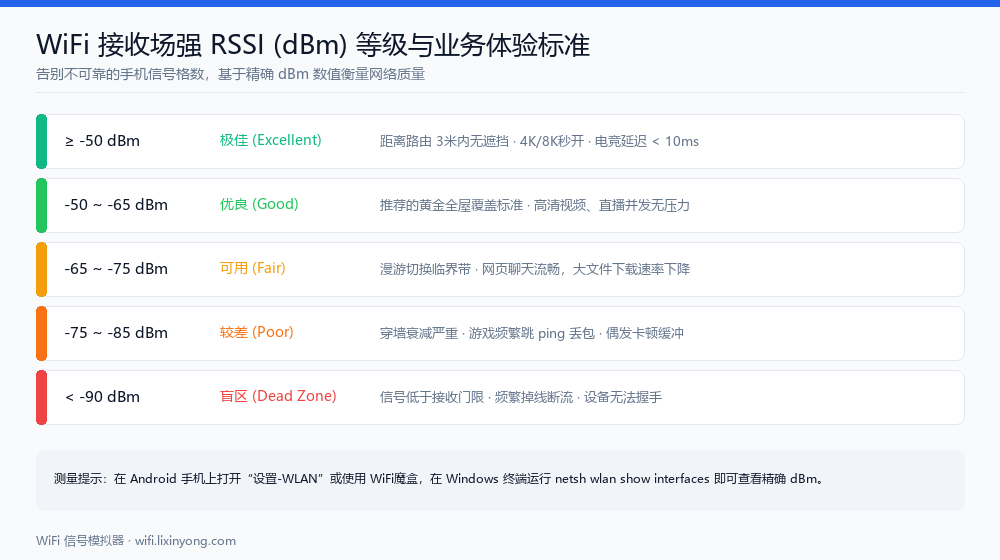
dBm banding chart
| RSSI | Grade | What it feels like |
|---|---|---|
| ≥ −50 dBm | Excellent | Right next to the router, full protocol rate |
| −50 to −60 dBm | Very good | Everything is smooth, including 4K and large transfers |
| −60 to −67 dBm | Good | Stable video calls and streaming — the recommended design target |
| −67 to −75 dBm | Usable | Web and SD video fine, high-bitrate starts dropping frames |
| −75 to −85 dBm | Weak | Connects but unstable, throughput clearly down, drops likely |
| −85 to −95 dBm | Poor | Barely holds a link, not really usable |
| < −95 dBm | Dead zone | No usable connection |
Design for −65 dBm. That is the line between "everything stable" and "problems begin", and it is the contour the simulator draws by default. Headroom matters: people moving, doors opening and a running microwave each shift things by a few dB.
Why signal bars are useless
Bar counts are mapped by each vendor with no common standard. At the same −72 dBm spot one phone may show 3 of 4 bars and another 2. Worse, bars are very coarse in the strong region — anything from −50 to −65 dBm often shows full bars, yet that 15 dB spread is exactly what decides whether you need another AP.
The other trap: bars reflect field strength only, not congestion. Full bars on a stuttering 2.4 GHz network is common, because the problem is a channel packed with neighbours, not weak signal.
How to measure dBm
Android
Usually available in system settings: Settings → About phone → Status, near the WiFi MAC address. A WiFi analyser app is more convenient and shows dBm, channel and width for every nearby AP at once.
iOS
The system UI does not expose dBm. Use the official Apple AirPort Utility: install it, enable the WiFi Scanner toggle under Settings → AirPort Utility, then scan from within the app to see RSSI.
Windows
Run netsh wlan show interfaces and read the Signal field, shown as a percentage. Rough conversion: 100% ≈ −50 dBm, 50% ≈ −75 dBm, about 1 dB per 2%. Use a third-party tool if you need exact values.
macOS
Hold Option and click the WiFi icon in the menu bar — the dropdown shows RSSI and noise directly.
How coverage percentage is calculated
The professional method is grid sampling: divide the floor plan into 1–2 m cells, record dBm in each, then count the share of cells meeting target. Doing that by hand is tedious — a 100 m² home means dozens of readings plus drawing the map.
The simulator does exactly this, but samples every 4–8 pixels (at the default 60 px = 1 m, roughly one sample every 7–13 cm) and reports four coverage shares directly: excellent ≥ −60 dBm, usable −60 to −75 dBm, weak −75 to −95 dBm, dead below −95 dBm.
Combining measurement with simulation
Each has blind spots; together they are reliable:
- Simulate first, measure second: simulation compares many options (move it, add an AP, switch bands) at near-zero cost; measurement validates the final choice.
- Calibrate with one reading: measure 1 m from the AP. If it differs a lot from the model, your transmit power setting is off — adjust the power slider until they match.
- Verify the boundaries: walk the predicted dead and marginal zones. The strong middle rarely surprises you.
- Know what the model omits: furniture absorption, human bodies, neighbour interference and metal appliances are not included. Real readings usually come in a few dB below simulation, so leave headroom.
Map your own coverage
Draw your floor plan and place APs in the WiFi Signal Simulator, save, then simulate to get a continuous heatmap plus the four coverage shares. Enable the contour overlay in the Radio Parameters panel and the −65 dBm usable boundary is drawn as a dashed line, making the "enough / not enough" split obvious at a glance.
FAQ
Related guides
Try it on your own floor plan
Draw your layout, place a router and see whole-home coverage in seconds. Free, no signup, nothing leaves your device.
