
Does a Load-Bearing Wall Block WiFi? dB Loss Chart
Yes, and walls are the single biggest signal killer in a home. A reinforced concrete load-bearing wall costs about 17 dB at 2.4 GHz and 25 dB at 5 GHz — one wall removes more than 98% of the power. Here is the full chart.
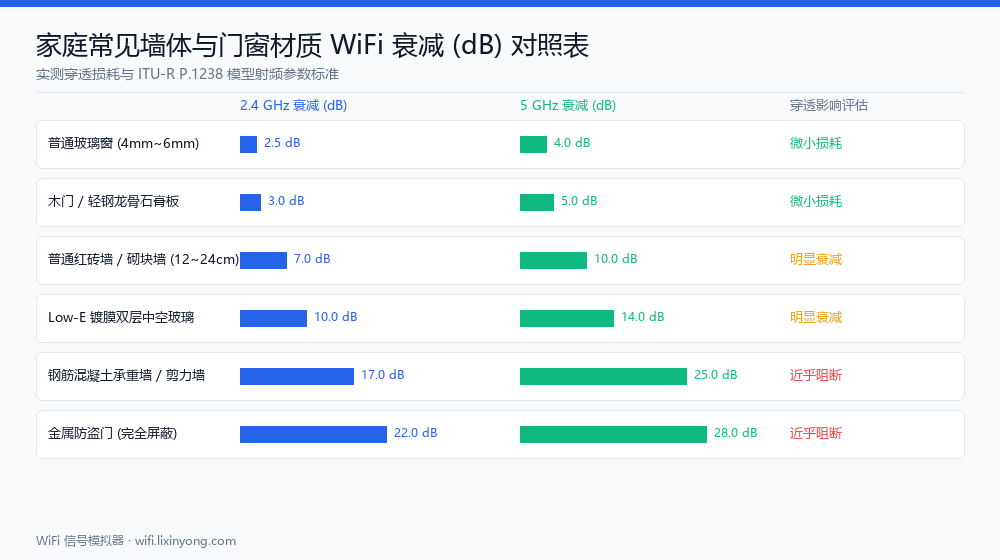
Wall loss reference chart
dB is logarithmic: every 3 dB halves the power, every 10 dB cuts it to one tenth. Keep that conversion in mind while reading.
| Material | 2.4 GHz | 5 GHz | Power remaining (2.4G) |
|---|---|---|---|
| Wooden door / stud partition | 3 dB | 4.5 dB | ≈ 50% |
| Plasterboard partition | 3–5 dB | 4–7 dB | ≈ 35–50% |
| Plain brick wall | 7 dB | 10 dB | ≈ 20% |
| Load-bearing brick wall | 10 dB | 15 dB | ≈ 10% |
| Concrete wall | 12 dB | 18 dB | ≈ 6% |
| Reinforced concrete load-bearing wall | 17 dB | 25 dB | ≈ 2% |
| Concrete slab (floor/ceiling) | 18 dB | 25 dB | ≈ 1.6% |
| Plain glass / glass partition | 2–4 dB | 3–6 dB | ≈ 40–63% |
| Coated glass / metal door | 15–30 dB | 20–40 dB | < 3% |
Note the last row: metal shields far more aggressively than concrete. Fridges, metal doors, Low-E coated windows and metal wiring cabinets all cast pronounced signal shadows.
Why hitting a wall at an angle is worse
Every number above assumes a perpendicular pass. In reality signal rarely meets a wall head-on — at an angle the ray travels a longer path inside the material, and the effective thickness scales as 1/cos θ.
At a 60 degree incidence the effective thickness doubles, so a 7 dB brick wall actually costs 14 dB; near grazing incidence it gets worse still. This explains a common observation: a room reached diagonally often measures worse than a more distant room reached straight through a doorway. Where you can, line the main path up with a door opening rather than cutting across corners.
How many walls before you hit a dead zone?
At 20 dBm, 8 m distance, with −95 dBm treated as dead:
| Walls crossed | Cumulative loss | Received strength | Usability |
|---|---|---|---|
| 0 | 0 dB | −45.3 dBm | Excellent |
| 1 brick | 7 dB | −52.3 dBm | Excellent |
| 2 brick | 14 dB | −59.3 dBm | Excellent (borderline) |
| 3 brick | 21 dB | −66.3 dBm | Usable |
| 1 concrete load-bearing | 17 dB | −62.3 dBm | Usable |
| 2 concrete load-bearing | 34 dB | −79.3 dBm | Weak |
| 3 concrete load-bearing | 51 dB | −96.3 dBm | Dead |
Rule of thumb: 2.4 GHz survives about two load-bearing walls, 5 GHz only one. Beyond that, add an access point or run cable rather than buying a more powerful single router — transmit power is capped by regulation (commonly 20 dBm / 100 mW), so there is very little headroom.
Why wood ignores the load-bearing flag
Ticking load-bearing on a wooden wall has no effect in the simulator; it is deliberately ignored. The reason is practical: timber partitions are essentially never structural, so marking one load-bearing is a data-entry mistake — and even genuine timber structural walls are nowhere near concrete in thickness or loss. Ignoring the flag prevents a mis-tick from distorting the result.
Map your own walls
The chart gives per-wall magnitudes, but real signal is the sum of every loss along the path plus distance loss and corner diffraction. Assign a material to each wall in the WiFi Signal Simulator and mark the load-bearing ones — you will see immediately which room is weak from distance and which is blocked by one specific wall.
FAQ
Related guides
Try it on your own floor plan
Draw your layout, place a router and see whole-home coverage in seconds. Free, no signup, nothing leaves your device.
